4.3 Separating trends from deviations
As the world started to bounce back after the Covid-19 pandemic another ailment began to rear its economic head: inflation. For many people inflation may not have been something they’d ever thought about. Inflation wasn’t new –the UK government for years had maintained a target of 2% annual inflation. If the rate ever moved above this the Governor of the Bank of England had to write a letter to the Prime Minister to explain why. But as Covid lockdowns began to ease and the world tried to get back to normal, inflation started to pick up beyond this target. Many factors played into why this happened, but the reality for consumers was that it rapidly became very noticeable. With inflation running at rates sometimes higher than 10%, prices became noticeably more expensive, which in turn drove an increase in interest rates, which also drove up costs of borrowing. But when it came to the prices people paid there was a persistent question in the media over whether price increase were driven by inflation or opportunistic retailers? A 10% rate of inflation means that something costing $10 one year will cost $11 a year later. But if a retainer instead increased their prices to $13 was that a 30% increase year-over-year, or a 20% increase above inflation? The obvious parallel should be to look at marketing budgets. What happens if year over year your marketing budget remains flat in an environment where inflation is at 10%? If costs are going up, and budgets are flat you have less spending power, which is the equivalent of a budget cut.
Every year between the months of June and September, significant parts of Europe slow down for summer holidays. This seasonal change is pretty predictable and consistent year over year. As a result most marketing metrics over the course of a year will show a seasonal variation within them. Over the summer months opportunity creation slows down as sales people and prospects are out of the office, and as a result Marketing activity slows and spend also slow down. Understanding this is important. If you were to look at cost for digital ad inventory through the third quarter of a year you might see a significant decrease in cost because it is less attractive. In abstraction, a digital team reporting ‘35% reduction in Q3 cost per impression’ can sound like a great improvement. Well done, you’ve earned your bonus. But if that happens every third-quarter of the year it should be disconnected from digital performance in reporting. What you should really care about is achieving that in quarters where it is not driven by an underlying trend.
Underlying trends can be conveniently easy to ignore when it is advantageous and usefully notable when they solve a problem. Let’s say you’re working for an organisation that has a great new product in the market with growing brand awareness. Will you abstract the positive brand growth from your year-over-year demand generation analysis? Demand generation activity, including creative, social and media engagement will all see improved benefit from increased brand recognition. Of course, they will also contribute towards driving that brand recognition. The point here is that underlying trends can influence performance significantly depending upon the metrics that you look at. Concluding that creative assets have suddenly improved in quality because they have a 1% higher click-through rate may be entirely the wrong conclusion if brand awareness over the same period had increased by 10% and there is an expected correlation.
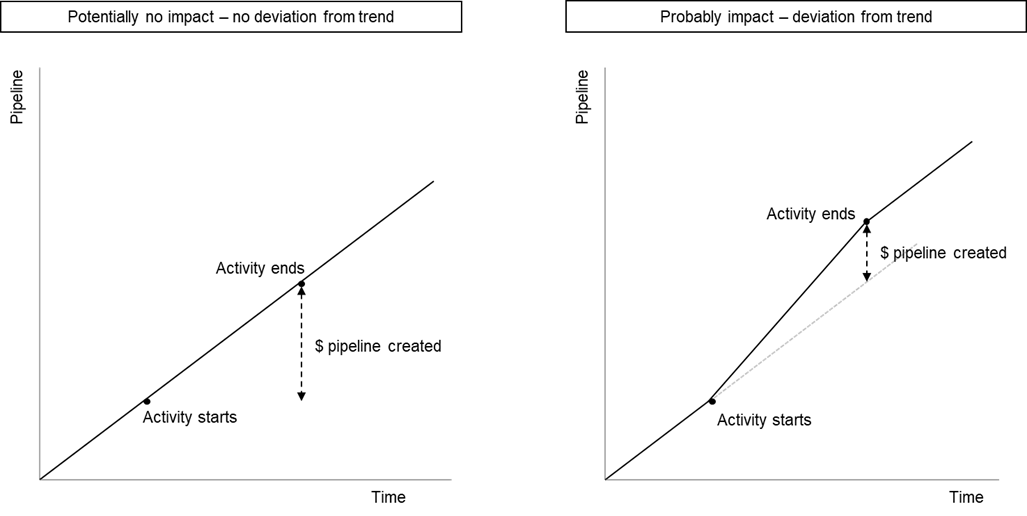
The only way to understand if activity is actually driving action is to abstract trends from impact. Of course, this requires an understanding of the trends themselves, which can be difficult when you don’t recognise that a trend exists. Trends can occur because great work is consistently done, such as brand being built by integrated, consistent activities even if their primary objective wasn’t brand-building. But this type of trend is one driven by activity and in some way connected to a plan. External trends such as seasonality, inflation or industry changes are far better benchmarks to compare against as they differentiate what you’re doing to create deviation from the trend that will continue regardless.

